

You really don’t have to reinvent the wheel. See, every time your report is due you start from scratch. The time has come to get a Google Analytics reporting template that you can use over and over again. I’ll show you how to do this through an analytical report example.
In this article, we look at the things you need to consider when choosing and customizing a Google Analytics report template.
Who Is the Audience for the Report?
To create an effective report, you need to know what matters most to the target audience. There is no one template that can suit everyone’s needs. Your audience will fall into one of two groups:
The first group consists of high-level thinkers. These are the people who want the big picture. They are busy and only want to know if the business is growing.
 The second group is marketing teams. These look for the next big idea. They are tech-savvy and want more insights to help in building strategy and to plan new initiatives.Â
Creating reports for each of these two groups may be a bit different
What is the Time Frame?
An important factor to consider when designing report templates is to think about the variable time frames. So some members of your audience may require monthly, quarterly or annual reports.
Each time frame dictates the content that should be part of the report. For example, a monthly report should be brief. However, annual and quarterly reports should be more in-depth with data and graphs.
Over time, you will understand what your target audience expects from your reports.
Key Performance Indicators (KPIs)
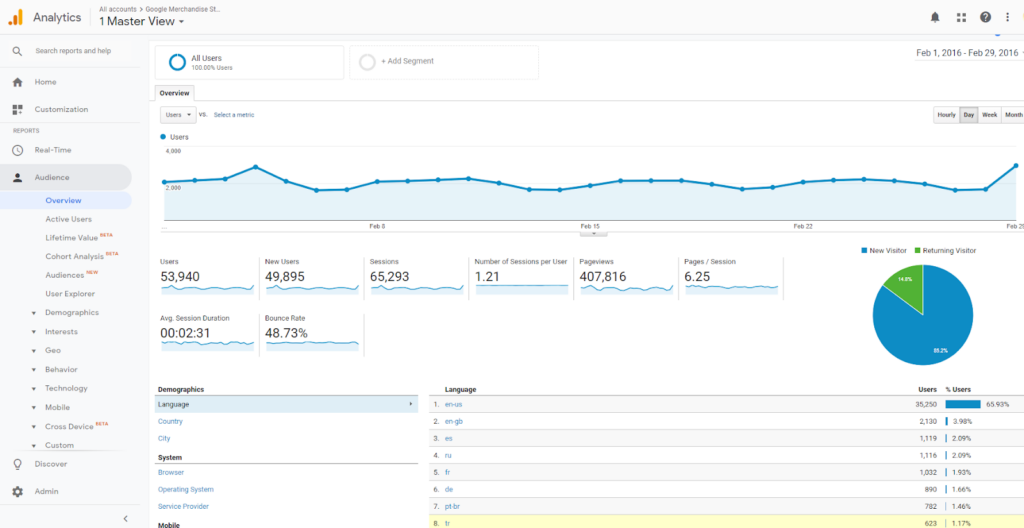
Among the very first things, you will do in your Google Analytics report template is set up the KPIs. KPIs refer to the metrics that the client is shooting for.Â
Here are some of the KPIs that both managers and marketers will want to know:
Sessions
Sessions refer to the total number of sessions that occurred on a website.
Users
This KPI refers to the number of site visits made by new users as opposed to those made by repeat users.
Average Session Duration
This is the mean time period that visitors spent on the website.
Conversions
Conversions refer to the interactions that are being tracked and the goals that visitors take on the site.
Provide Context With KPIs
When presenting KPIs to clients, you need to provide context. If presented without context, the numbers mean very little. If you present these figures with data from a previous period, you get a clear picture of the direction of your marketing efforts.
Analytical Report Example: A Review
This article has shown you the importance of considering your audience, the time frame, KPIs and providing context. With this in mind, it is not difficult to choose an analytical report example template.
Geeks of Digital is an analytics-driven online marketing and content production agency. We are experts when it comes to Google Analytics. Get in touch so we can use Analytics to take your business to the next level.
0 comments