There are many analytics platforms today. A simple Google search for the phrase “web analytics†will yield 264 million results. Basically, whatever you think of, you can create data and reports for it.
The truth is that at the end of it all, the one analytics platform that stands out the most is Google Analytics. In this article, we look at how to understand Google Analytics audience reports.
Traffic Channels
One of the most basic but important reports in Google Analytics is the Traffic Channels, which you get to by clicking on Acquisition.
Once you open this report, it gives you an idea of the channels that bring in the highest traffic. Likewise, it shows you the areas of your site that require your attention.
In the pages that perform poorly in terms of traffic, you may discover that your headlines are weak or that the page content needs some improvement. In some instances, you may find it worthwhile to scrap some channels.
Behavior
The reports in the Behavior section of Google Analytics help you understand what your visitor’s journey looks like. This helps you know the pattern they take from when they arrive at the site, to when they leave.
If they leave the site, you want to know whether they left for the right reasons or the wrong reasons. To get to the Behavior Flow screen, click on Behavior > Behavior Flow.
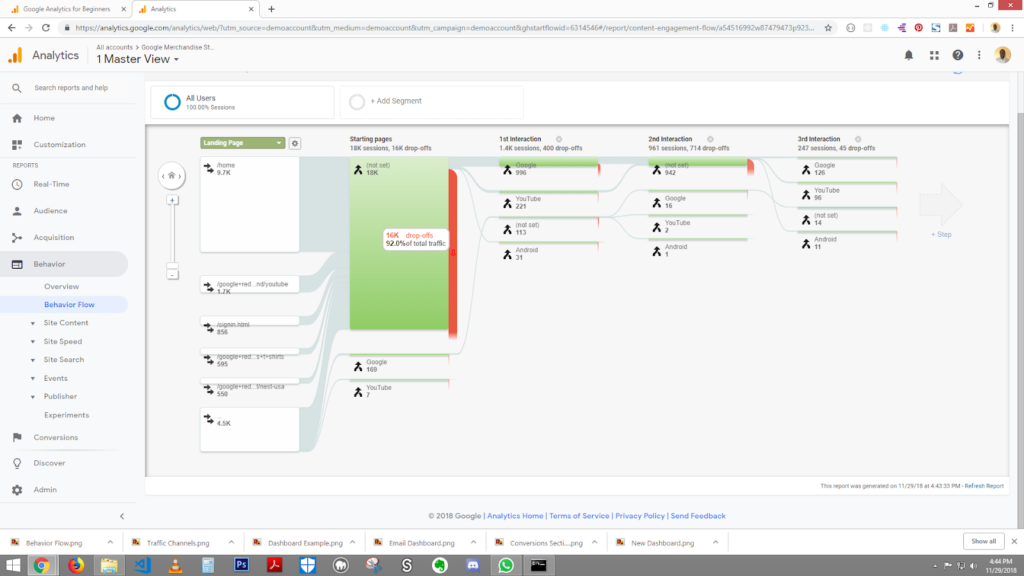
You should now be seeing a funky report that looks like the image below.
This can be confusing at the beginning, but to understand the data, you want to navigate from left to right. When you look at the “Starting Pages,†you will see the pages on which your visitors land on initially.
Then moving right, you can see their interaction based on the images they click on next. The grey lines connecting the pages show you the exact path they followed.
Another important thing to keep an eye on is the drop-off rate. This is the red box directly next to each green box. When you hover your cursor on top of each red box, you will see the actual number of people who dropped off.
In case there are pages with high drop off rates, you want to identify the issues that are stopping your visitors from converting and becoming customers.
One way is to improve the copy on the page, alter the position of your call to action and even add trust indicators. At times, the problem will be obvious, while at other times, you will have to do tons of experimentation.
A Review on Google Analytics Audience Reports
Understanding your traffic numbers and the behavior of your site visitors is the first step towards improving your site performance. In this article, we have looked at the Google Analytics Audience Reports, specifically the Traffic and Behavior Flow data in Google Analytics.
Geeks of Digital is an analytics-driven online marketing and content production agency. We are experts when it comes to Google Analytics. Get in touch so we can use Analytics to take your business to the next level.


0 comments