

In this article, we will look at the behavior and site content Google Analytics report example. We will see why these reports are important and how you can use them for maximum insight.
Behavior Report
Behavior flow data about your website is not only interesting but also confusing aspect of Google Analytics as it combines data from other reports. This report shows you the number of people on your site, how they move on the site and where they leave the site.Â
With the behavior flow, you can see the most popular path that people use through your site. Knowing this will help you prioritize changes on the site.Â
How does this happen?
Let’s assume that you only have 20 minutes the entire week to work on your site. What will you focus on? Most likely, you will focus on the pages that people often visit.
As such, if you have a great infographic, article of a client testimonial, this report will help you place it where the most number of people will see it.
Why is this important?
Think of your website as a city. Where would you place all the billboards? Most likely, you would place them on the highways with the greatest amount of traffic as this will give you the highest returns.
Site Content Report
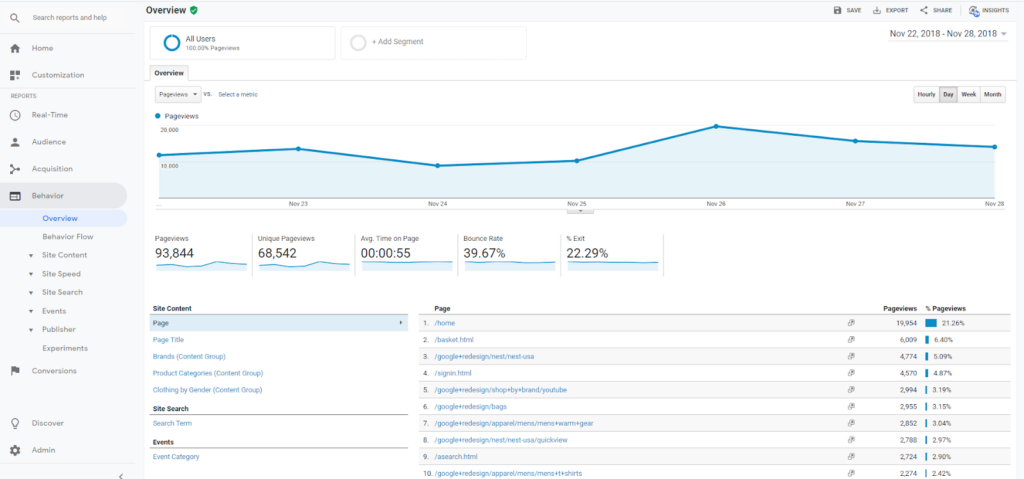
The second Google Analytics report example we look at is the site content report. The All Pages report in Google Analytics gives you the most important pieces of information. You can find it under Behavior > Site Content > All Pages.
This report lists all the URLs on your site, allowing you to see the behavior flow for each page. You can either scroll to find a post or use the search feature.

Once you locate the post you want to analyze, first look at the Navigation Summary tab that sits next to the Explorer tab. This shows you the pages on your site that brought visitors to the pages and the pages they went to next.
Ideally start with your homepage to see the items in the main navigation that people click on the most, and those that they click on the least. This will allow you to optimize the page for user experience.
Basically, you can make what’s working even better. At the same time, whatever is not working, you can improve upon.Â
Let’s say you have a red call to action button that people are not just clicking on. In an effort to improve its performance, you can increase white space around it, change the text to highlight a benefit or change the color.
If people still do not click on an item, think of removing it. With fewer items on the page, visual clutter reduces and what is left appears more prominent. Things become easier for visitors to find.
Conclusion
As you can see from this Google Analytics report example, you can get a lot of actionable insights. You can make educated decisions about your website and how to improve it.Â
Geeks of Digital is an analytics-driven online marketing and content production agency. We are experts when it comes to Google Analytics. Get in touch so we can use Analytics to take your business to the next level.
0 comments