

Why is understanding and creating custom reports in Google so important? Custom reports are important because, with the data you get, you can improve your business.Â
In this article, let us see how to create Google Analytics report. This will allow you to collect the data that is most crucial to the growth of your business.
1 | Create a Custom Report
After you log into your Google Analytics account, go to Customization > Custom Reports. Then, you will see a button marked “+ New Custom Report.†Click on it.
Next, give your custom Google Analytics report a name. This is important because you may want to create another custom report in the future. The names help you distinguish the reports.
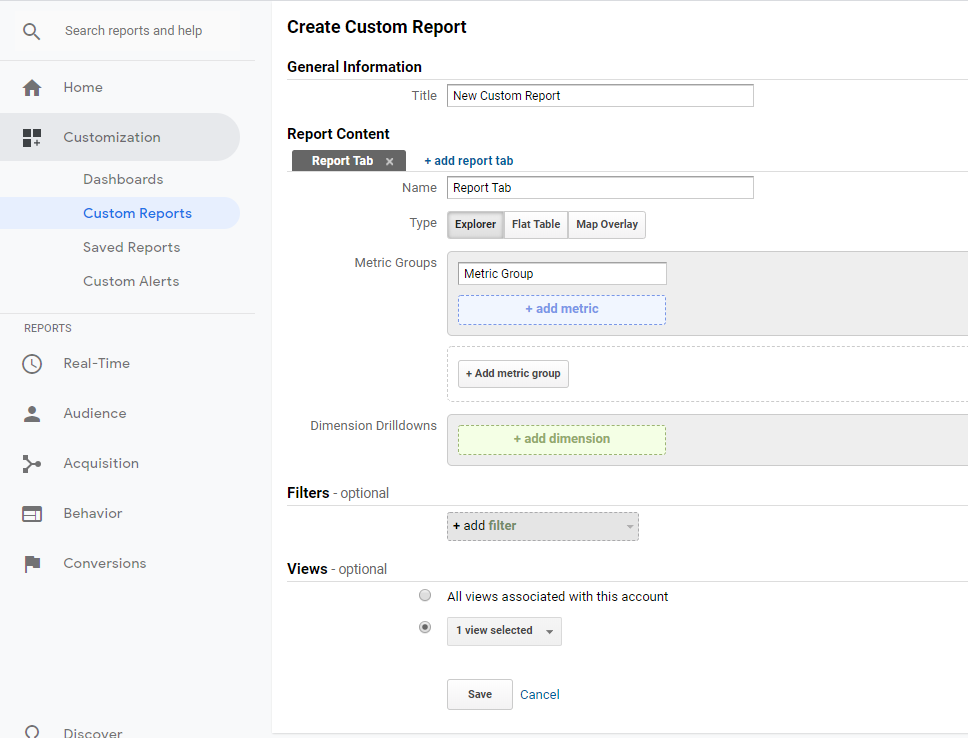
2 | Choosing a Custom Report Type
Every custom report in Google Analytics has one tab. You, however, have the option to add as many tabs as you want into your custom report. Now, you need to choose from three report types.
Type 1 | Explorer
This is the default Google Analytics report. It has a line graph and a dynamic searchable table. By dynamic, I mean that you can sort the table using any column and secondary dimension.
Type 2 | Flat Table
This is a static custom report that displays data in rows. You can sort the table using the different columns available.
Type 3 | Map Overlay
With this report, Analytics shows you a world map. The countries and regions where your traffic is from have darker colors. This shows the areas of the world from which you are engaging users.
3 | Choose the Custom Metrics for the Report
Google Analytics will present you with different metrics based on the custom report type that you choose. Nonetheless, the metrics you choose for your report will determine the data to be included in the report.
Let’s assume that you want to add % of new sessions and bounce rate. Simply click on the “+ add metric button,†scroll down the list to the metrics that you want and then click on them.
For more control over the metrics, you can add dimensions. Click on the “+ dimension†button. Now, you can break down the metrics based on things such as the browser type. This way, you get more data about your site.
4 | Add a Filter
Finally, you can add a filter to your report. This is an optional step, but an important one because you can restrict the data that gets to your custom report.
For example, for the browser dimension, you can restrict the report so that it only shows the browser activity on specific browser types like Chrome, Safari or Firefox.
Now click Save and your custom report is available for use. After saving, Google Analytics shows you the custom report data.
Conclusion: How to Create Google Analytics Report
This article has shown you how to Create Google Analytics report. If you want to see the report in the future, all you need to do is to navigate to Customization > Custom Reports.
Geeks of Digital is an analytics-driven online marketing and content production agency. We are experts when it comes to Google Analytics. Get in touch so we can use Analytics to take your business to the next level.
0 comments