

When it comes to your website, knowledge is power.
Without the knowledge of what is happening on your site, you are traveling blind. There is no way of knowing how people get to your site. What’s more, you have no idea what they do when they get there.
When you have the knowledge, however, you can improve the performance of your website.
This is why Google Analytics Reports are so important. When properly used, Google Analytics gives you a ton of information about your users, their origin, and their actions. However, Google Analytics is complicated at first.
The purpose of this article is to address this problem. You will see the three main Google Analytics reports that give you the most insight into your website. These reports will give you the most insight on what people do on your site.
Simplifying the Difficult to Understand Parts of Google Analytics ReportsÂ
The thing is….
Google Analytics is complicated and overwhelming for most people. This is the case particularly for beginners as they don’t know where to start.
You will learn how to dig deeper into the reports and find out more valuable information to bring in more sales and revenue. I have provided lots of screenshots of Google Analytics in this article so you have some reference.
If you want to follow along, which you should, I suggest signing up for a Google Analytics account. If you already have one, please launch it and let’s get started.
Google Analytics Reports and the Customer Value Journey
Before running any marketing campaign, you need to understand the value that you offer to your customers. You need to understand the difference that your products will make to different customer segments.
The customer value journey has eight steps:
- The aware stage – How the customer knows you exist, as well as your products and services,
- The engage stage – How you develop a trustworthy relationship with your audience.
- The subscribe stage – Prospects know and trust you. This is where you get your prospects’ contact information.
- The convert stage – Some subscribers will remain engaged to a level that they are ready to commit with their time and money.
- The excite stage – So far, the prospect has converted. Now you need to make them buy more products from you.
- The ascend stage – At this stage, you make your customer ready to purchase more products from you more often. You present your core offer.
- The advocate stage – Now that you have happy customers purchasing from you frequently, you need to make them advocates of your brand. They become passive promoters.
- The promote stage – At this stage your customer starts actively looking for opportunities to spread the word about their experience with your company with their friends and family.
The following three Google Analytics reports give you important information on the customer value journey. With this information, you can easily optimize your site to push prospects from one stage to the next in the customer value journey.
Report 1: Source/Medium Google Analytics Report
Of the three reports discussed in this article, the source/medium report is the most critical.
Here’s why:
It gives you a high-level overview of your site’s performance based on traffic source. You access this report by going to “Acquisitions†> “All Traffic†> “Source/Medium.â€
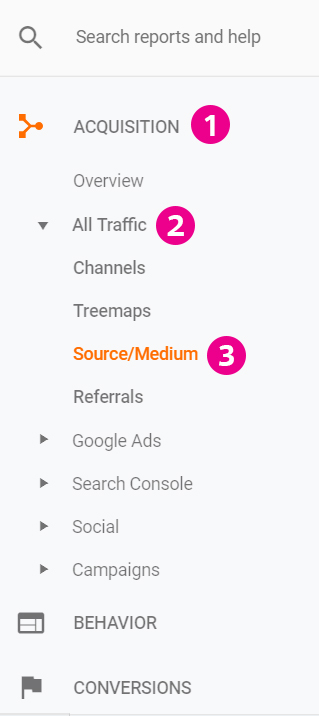 When the page loads, you will see a graph at the top of the screen. Scroll down until you see a table, which is where the most important data lives.
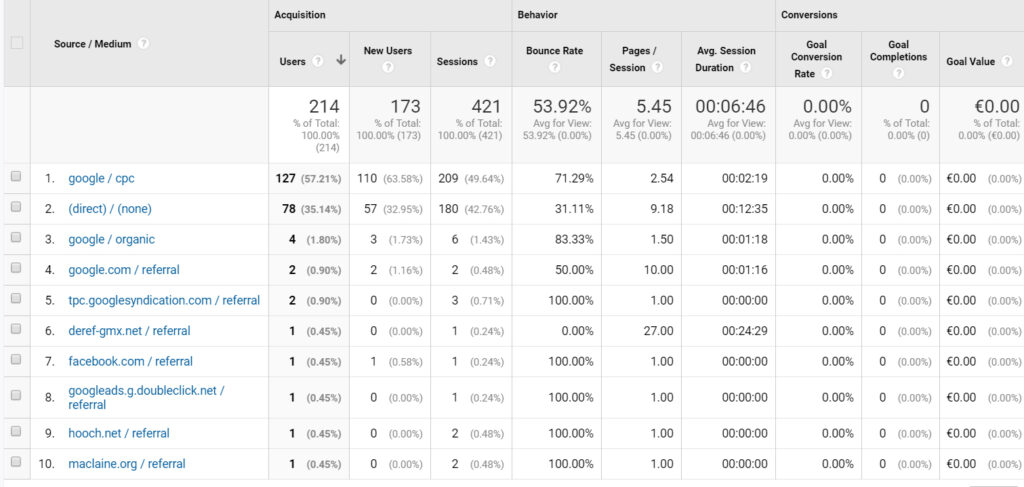
On this table, you see all the sources of traffic to your website together with how each one performs.
For each traffic source, you see the number of visitors coming to the sire, their engagement levels and the conversions/purchases each one generates.
In this report, you should keep an eye out for the things that stand out.
For example, you might notice that traffic from Instagram has a 60% bounce rate while traffic from YouTube has a 10% bounce rate.
You realize right off the bat that people getting to your site from YouTube will engage more with your site and visit more than one page than those getting there from Instagram.
With this information, optimizing your website is easy.
For example, you may make design changes to prioritize YouTube over Instagram. Alternatively, you may make changes to increase the engagement rates of the people getting to the site via Instagram.
The Source/Medium report is also important because it gives you a bird’s eye view of your site’s performance. It gives you an overview of sales and revenue figures for each traffic source.
For example, you may notice that despite the fact that YouTube is your highest source of traffic, it brings you fewer sales than Instagram.
Ask yourself: What does this report tell me about prospects and their position in the customer value journey?
Tagging Traffic to Get the Most Out of the Source/Medium Report
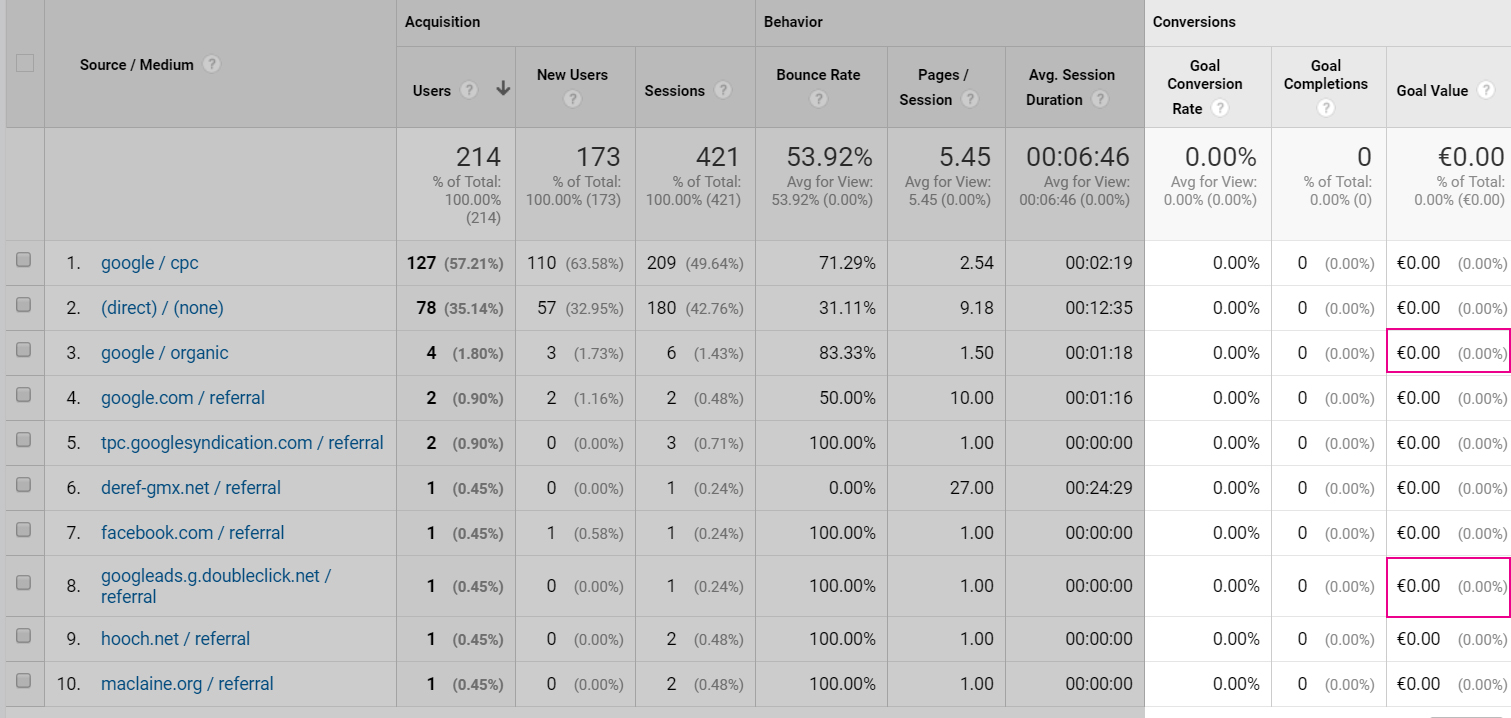
If you go to the menu under Source/Medium, you will notice that there is an item known as “direct/none.†This is where Google records visitors that it can’t determine where they came from.

Â
These are the people who typed your URL into their browser, or clicked on an untagged link. The “direct/none†report is not very useful, but it tells you one important thing: Tag all your links.
When you tag your links, Google knows where the traffic is coming from. Not only does this give you more actionable information, but also increases the ease with which you can organize your analytics reports.

Tagging your links just means adding some code at the end of your URL. After adding the code, the link looks something like this:
https://yourwebsite.com/?utm_source=newsletter&utm_medium=email&utm_campaign=widget
So, if someone clicks on this link, rather than going to “direct/none,†they will show under the “newsletter†source and the “email†medium. To tag your links, visit the Google Campaign URL Builder.
You might be wondering if anything can be done about the long, ugly URL.
To get around this, you can use a URL shortening service like bit.ly, which hides the additional parameters.
Report 2: Landing Pages Google Analytics Report
The Landing Pages Report is the next report that you need to pay close attention to.
What do we mean when we say landing page? For most people, this is an opt-in page on which someone can subscribe. In Google Analytics, the words “landing page†is the first page someone sees when visiting your site.
Therefore, if someone moves from “Homepage > Services > About > Exit,†then “Homepage†is your landing page. If they go to “About Us > Homepage > Exit,†then “About Us†is the landing page.
What’s amazing about this report is the fact that it breaks down every session people had on the website based on the landing pages that got visitors on your site in the first place.
With this information, you can easily compare the performance of different pages to see the one that keeps users most engaged.
To get the “Landing Pages†report, you go to “Behavior > Site Content > Landing Pages.â€

Just like the source/medium report, the most important information in the “Landing Pages Report†lies in the table at the bottom of the page. The column on the far left lists all the landing pages on your site.
If you look at the “Bounce Rate†column, you will notice that some landing pages are much better at engaging your visitors than others.

If you come across a landing page with a very high bounce rate, you can try to troubleshoot and see what the problem is.
The other two columns that you should pay close attention to are “Pages/Session†and “Avg. Session Duration.†These two columns give lots of insights on the performance of your landing pages.
For example, if after visiting a landing page the average visitor visits another five pages on the site before leaving, and sticks around for a longer time, then that page is very effective at engaging visitors.
Take a close look at the landing pages that perform the best and those that don’t and look for ways to leverage the high performers while improving the low performers.
Cool, right?
And what’s more, when you start combining the insights that you uncover from the two reports, you really start tapping into the power of Google Analytics.
Ask yourself: What does this report tell me about prospects and their position in the customer value journey?
Looking Back
If you can recall, you analyzed your website by looking at each traffic source individually in the first report. Despite the fact that we’re in a different report now, you can apply “Source/Medium†using a secondary dimension.
By doing this, you can analyze all your landing pages based on the traffic source.
How do you apply a secondary dimension?
You simply click on “Secondary Dimension†above the table, click in the search bar and enter “Source†and then click on “Source/Medium†to apply the segment to the table.
This will add a new column to the table labeled “Source/Medium.†This now shows you how each page performs based on the source.
If you want to see the individual performance of each page, you can just click on its link in the first column of the table. This will show you data on that particular page and its associated traffic sources.
This can give you very useful information. For example, you might notice that even though most of your traffic is organic, it doesn’t account for too much revenue.
Just knowing this gives you lots of ideas on what you can do differently. You could, for example, alter your homepage so that it speaks more directly to people coming from higher revenue-generating sources.
But here’s the deal:
This report gives you data on the entire session of your users. In Google Analytics, a “session†is simply a visit.
Let me explain:
When you visit a website, look around and then leave, this is one session. If you visit the website on another day, this is another session. So, the “Landing Pages†report shows you what happens during the whole session.
So, if you see that a landing page has 300 transactions under the “Transactions†column, it doesn’t necessarily mean that those transactions happened on that page itself.
Rather, it means they occurred after a person visited that page, possibly on another page. In other words, the transactions occurred after the person started their session on the homepage.
Report 3: Product Performance Google Analytics Report
The Product Performance Report gives you a detailed overview of your e-commerce sales broken down by product. To access this report, go to the “Conversions†tab which contains all reports on site conversions.
Go to “Conversions > Ecommerce > Product Performance.â€
The Product Performance Report is broken down by product, allowing you to view sales performance for each product you sell on the site. It shows you the amount of revenue you generated for each product.
The report also has a breakdown of your sales based on average price, quantity, and refunds. You can get lots of insight from this report just by looking for the anomalies.
For example, looking at “Unique Purchases†and “Quantity†columns give you an idea of the number of people purchasing several copies of your product.
This gives you a lot of insight into the purchasing habits of the visitors on your site. Just like the “Landing Page†report, you can segment this report by a secondary dimension to access data that is even more focused.
For example, if you segment by “Source/Medium,†you can find out the traffic sources that bring the most sales for each product.
For instance, you might notice that visitors getting to your site through YouTube bring in ten times more revenue than those from organic traffic.
This suggests that you should spend more time creating YouTube videos than seeking organic traffic. You can also segment the report based on the landing page to identify the landing page with the most product sales.
Applying secondary dimensions to your report can help you uncover a ton of useful insights. For example, you can determine if people from different traffic source purchase the same kind of products.
With such insights, it is possible to drive more traffic through your best sources, and to the best-performing landing pages to increase sales even more.
Ask yourself: What does this report tell me about prospects and their position in the customer value journey?
Conclusion
At first, Google Analytics reports can be very intimidating. So, the ideal way to familiarize yourself with it is to take it one report at a time.
One reason that makes Google Analytics seem so complicated is that people usually start clicking around and looking at different types of reports at the same time.
Doing this will only confuse and frustrate you.
The ideal method is to just focus on a single report and try to uncover as much information as possible from that report. When you get a grasp of that one report, you can move on to the next report and so on.
One great thing with Google Analytics is that when you understand how to use one report, you can instantly start using it as a secondary dimension in other reports.
This is why it’s important to move slowly and figure out things piece by piece. You can start with the Source/Medium report and when you finally grasp it, move on to other reports.
When used properly, Google Analytics will give you lots of actionable information on your site visitors, and their stage on the customer value journey. You can this optimize for more conversions.
I really hope that this report has shed light on Google Analytics and the primary reports that you should focus on. In case of any question, comment or suggestion, please address it in the comments section below.
0 comments