

Google Analytics is a must in digital marketing. Surprisingly, it is extremely underused by businesspeople. With Google Analytics, you can measure the performance of your campaigns in real-time, which you’ll understand from this “Google Analytics Explained” article.
This blog post explains some of the reasons why you should be using Google Analytics. I will show you how Google Analytics custom reports measure the success of your website.
Google Analytics Shows You How All The Channels Are Performing
Using Google Analytics, you can get data about all the channels that direct traffic to your site. These channels are grouped as organic, paid, social, referrals and direct traffic.
By allowing you to review how all these platforms perform, it becomes easy to see what works and what doesn’t. With all this data in one place, you can compare how the different channels perform.

Acquisition reports show your website’s source of traffic.
For the areas that perform poorly, you can now look for ways to boost the ROI. The bounce rate lets you know which landing pages and blogs need improvement.
Tracking Conversions
Knowing the number of people who visit your site, their origin and how they engaged with your content is important. However, you need to know whether or not they convert.
With Google Analytics reports, you can set up goals that track whether or not your visitors complete certain actions.Â
 Conversions show you how well your campaigns are doing and whether visitors are doing what you expect of them.
Here’s the deal:
It doesn’t matter how many users each channel delivers to your site. If the traffic is not converting into leads and paying customers, then there is no purpose to your efforts.
Customer Engagement
There are a number of metrics in Google Analytics that help you see how well the users interact with the website. Let us look at some of these metrics.
The bounce rate refers to the percentage of your visitors that leave your site without any interaction after viewing only one page.
 Do your users leave immediately after landing on your site or do they interact with it? This is the purpose of the engagement report.
The pages/session metric shows the average number of pages that every visitor viewed, excluding those that have bounced.
The average session duration shows the average amount of time that each visitor spends on the website, excluding the visitors that bounced off the website.
Google Analytics allows you to see these metrics based on single pages. This gives you more insights into what you need to improve on a content-by-content basis.
Device Overview
Google understands that people use mobile devices more to access the internet than desktops. There is no question that if your site is not mobile-friendly, you will rank low in the search engine results.
With Google Analytics reports, you can see the devices that visitors use to access your website. With this information, you can optimize your site to suit the devices that most of your visitors use.
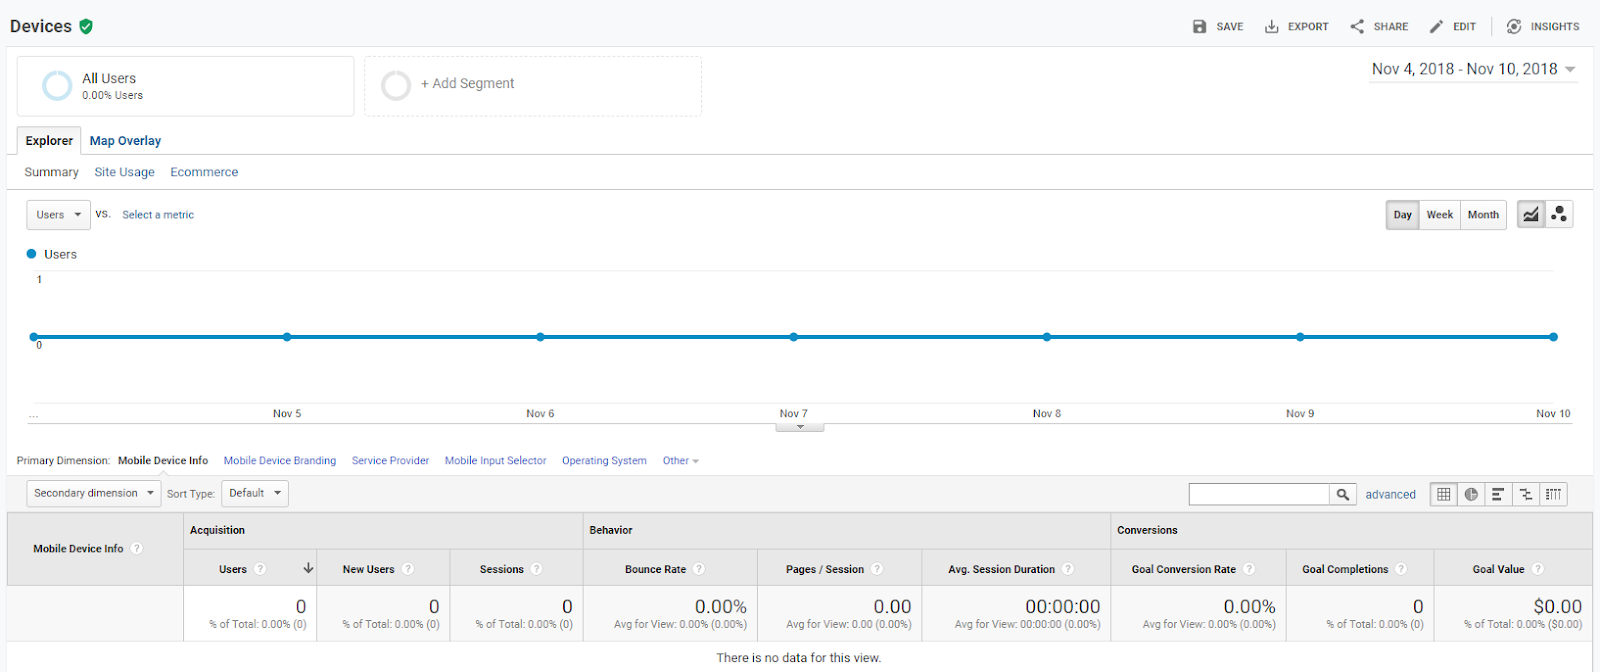
When you know the devices that your best visitors use, you can optimize your content for that device to improve the user experience.
When you receive a high number of visitors from all platforms, but one has a significantly poor conversion rate, you will know that it is a problem with the user experience for users on that platform.
Google Analytics Explained: A Review
Our Google Analytics explained article is unique because it shows you the major components of Google Analytics and why they matter. Google Analytics is focused on Audience, Acquisition, Behavior, and Conversions.
Geeks of Digital is a data analytics and content creation agency. Get in touch with Geeks of Digital today to get help setting up and using Google Analytics.
0 comments