
In this past article, I showed you how to create a Google analytics report. I also showed you how to manually add the code to your site and also, how to add it through a plugin. Here, we discuss the Google Traffic Report.
I’ll now assume that after a few hours, you got the message that Google Analytics was receiving data from your website. So, now comes the fun part: How do we get this data?
Website Visitor Statistics
During the first 24 hours, you will not see much. In fact, Google Analytics can take some time before it starts to fully work. When it finally starts working, you will be able to access live website data.
How to See the Blog Posts in Google Analytics
To see your blog posts and how they are behaving, you should go to the Behavior reports tab, then to Site Content and finally to All Pages. Let’s say you only want to see your blog pages and not the “About†or “Contact Us†page.
You simply head over to the “Advanced†link at the top just next to the search box. Change from “Include†to “Exclude.†Let’s say you don’t want your Contact page, assuming it is at yourwebsite.com/contact.

Pages show you how the performance of your posts so that you can know which ones resonate with your audience and which ones do not.
After the “containing†tab, add “/contact/â€
Now, you can save this filter for future use. Go to the admin tab in the bottom left of the sidebar. Then, under “view†create a new filter and save it. Such filters simplify your work saving you from re-creating new ones.
A Look At The Google Analytics Dashboard
As you have seen thus far, the main navigation is on the left-hand side of the screen where there are eight options. These are shortcuts, intelligence events, real-time, audience, acquisition, conversions, and behavior.
We will mainly focus on the Audience reports section. While the other options have their place, they really are not crucial towards your blog’s success in the beginning.
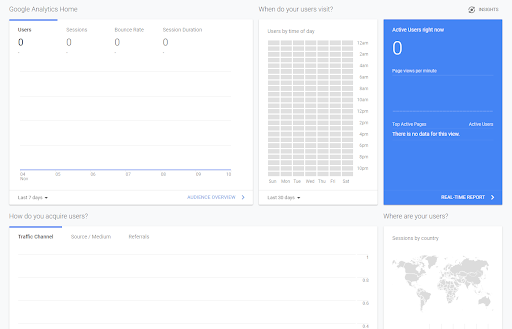
The Google Analytics dashboard shows you the most important information regarding your website’s performance.
Audience Report: Who Is Already Reading The Blog?
In the audience section of Google Analytics, you get information about the people visiting your blog. For instance, you get geographical data like location and language.Â
 When you know the language of your best visitors, you can alter the content to best suit them.
You also get technical data such as the devices they access your site with. Additionally, Google Analytics gives you some basic behavioral data.
Where Are Your Visitors Coming From?
When you know where your audience comes from, you can create better campaigns. This is especially if you are targeting people in a particular geographic region.
Let’s say your website is about life in Mumbai, but most of your visitors are from London. You have a problem, right? Knowing where your audience is from can also influence the way you write.
To know where your audience is, go to Audience -> Geo -> Location.
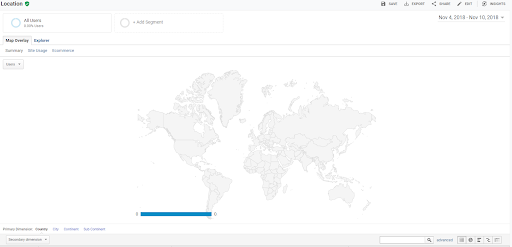 Knowing the geolocation of your audience helps you craft your content better to suit them.
There are two dimensions to view location data: City and Country. Remember that you will always get visitors from other cities and countries outside your geographic area.
What you should do is to concentrate on the area where the bulk of your traffic comes from.
The Google Traffic Report: When Will You Start Using It?
When you know the origin of your traffic, their language, characteristics, and countries, you can create content best optimized for them. This article has shown you how to read Google traffic report.
Geeks of Digital is a data analytics and content creation agency. Get in touch with Geeks of Digital today to get help setting up and using Google Analytics.
0 comments