Every blogger would like to know which of their posts bring them the most traffic, and which ones bring them the least traffic. With this information, you can better plan for future content, which is why you need to know how to read Google Analytics reports.
In this article, I give you a step-by-step guide on how to understand Google Analytics reports to help you understand your best and worst content pieces.
Learn How Your Articles Perform on Different Media
What you need to keep in mind is that content performs differently depending on the traffic source. Let’s say that one of your posts goes viral on social media.
Unless you do something else, it will only succeed in social media.
In order to get the same performance from other media like organic search, for example, you should have the website indexed so that it climbs in the search rankings.

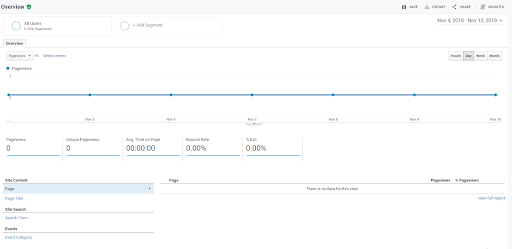
The Channels section of Google Analytics report shows the various channels that bring users into your website.
You can find this information in the Acquisition reports in Google Analytics.
It shows you the content that is performing best in each traffic source. In the “Channel” section, click on the traffic source you want to study. Then, make sure “Landing Page” is the Primary Dimension.
You will notice that each traffic source has the same engagement metrics as the “Channel” overview page. The only difference is that this will be broken up by the traffic source as well as individual messages.
The Behavior Tab: How and Where Readers Spend Their Time
In previous blogs, we have looked at the Audience and Acquisition parts of Google Analytics. These two sections show us the people who visited the website and how they arrived on the site.
Now the Behavior reports tab tells us how they act when they are face to face with the content.
The Behavior tab shows you how users behave once they land on your site.
What is the benefit of understanding your users’ behavior?
For starters, it helps you identify the content that receives the best response from users. Likewise, you get to identify content that performs poorly. This way, you can rewrite and redesign the content that performs poorly.
Again, you need to look at the way each blog performs. Look at the topics with session durations that are above average. These are the ones that your readers really enjoy reading.
To see this information, go to Behavior -> Site Content -> All Pages. Then, sort the results by the “Average Time on Page” column. Just click on the column header to allow a down arrow to appear.
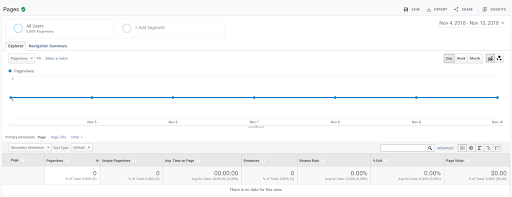
Once you export data out of Google Analytics, you can open it up in Excel or Google Sheets for more data analysis.
As soon as all the data is sorted, you will see which posts performed the best. Google Analytics reports also allows you to export the data into a CSV file if you want to manipulate the data in other ways.
In applications such as Excel and Google Sheets, you can easily remove irrelevant columns, make comments and sort the data. You can even add shares and tweets from apps like Buzzsumo.
Besides, you can add a column with which you group the posts based on the topics. With this, you can easily tell what kinds of content your audience likes reading the most.
Also, look at the bounce rate. You see, readers will eventually leave your blog. You need to make sure that they are leaving for the right reasons. They should not leave your blog because of poor design or boring content.
Exit Pages
The last page the visitor goes to before leaving the blog is referred to as the exit page in Google Analytics. You can find this by going to Behavior -> Site Content -> Exit Pages.

Exit pages show you the pages on which users leave your site. This way, you can change the content or add an opt-in form to pages with the highest exit percentages.
To get a better view, filter by the “% Exit” column. You want to see the pages with the highest number of exit pages. 45% – 50% is a normal exit rate, and under 45% is great. But anything over 50% deserves your attention.
How to Read Google Analytics: A Review
Setting up Google Analytics is easy. But without understanding the reports, you won’t achieve much. This article has shown you how to read Google Analytics reports.
Geeks of Digital is a data analytics and content creation agency. Get in touch with Geeks of Digital today to get help in the setup, use, and how to read Google Analytics.